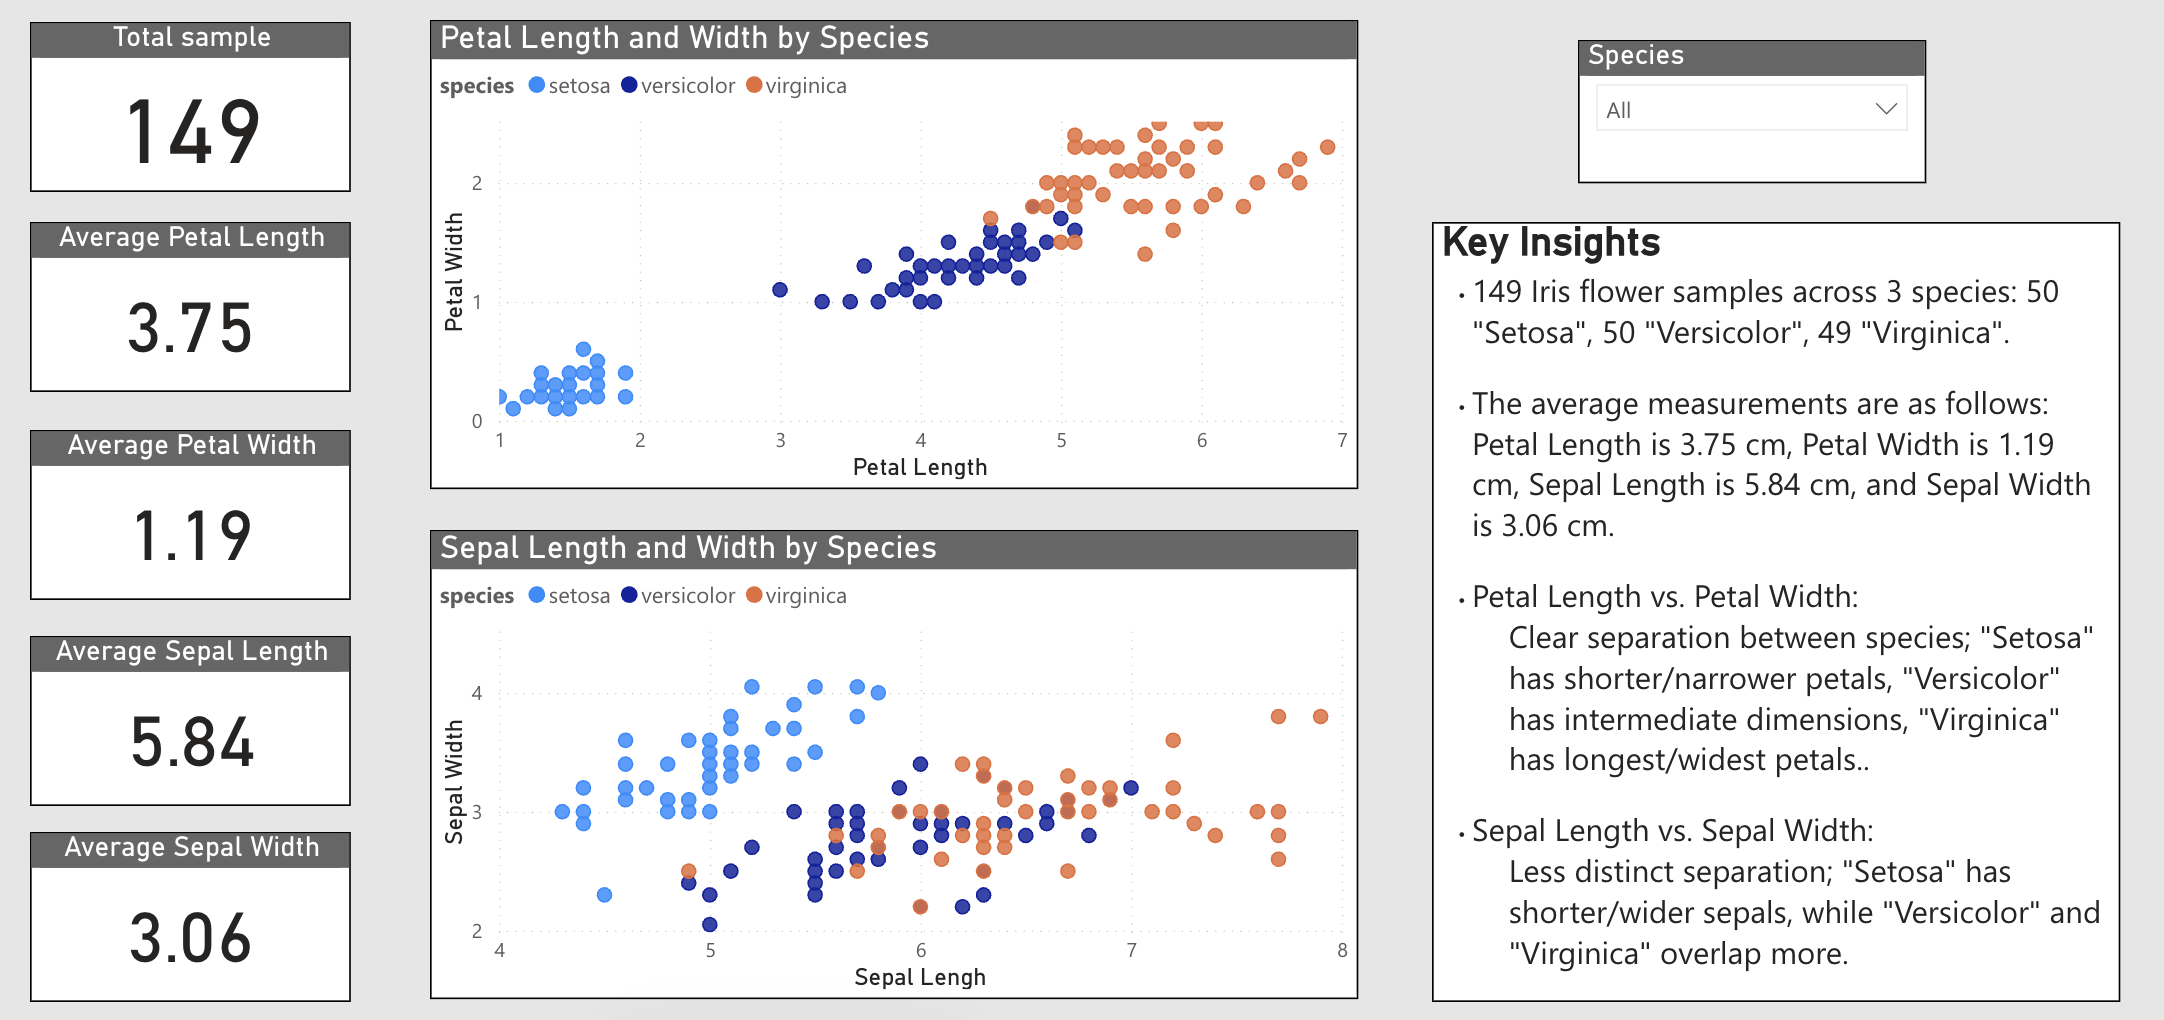
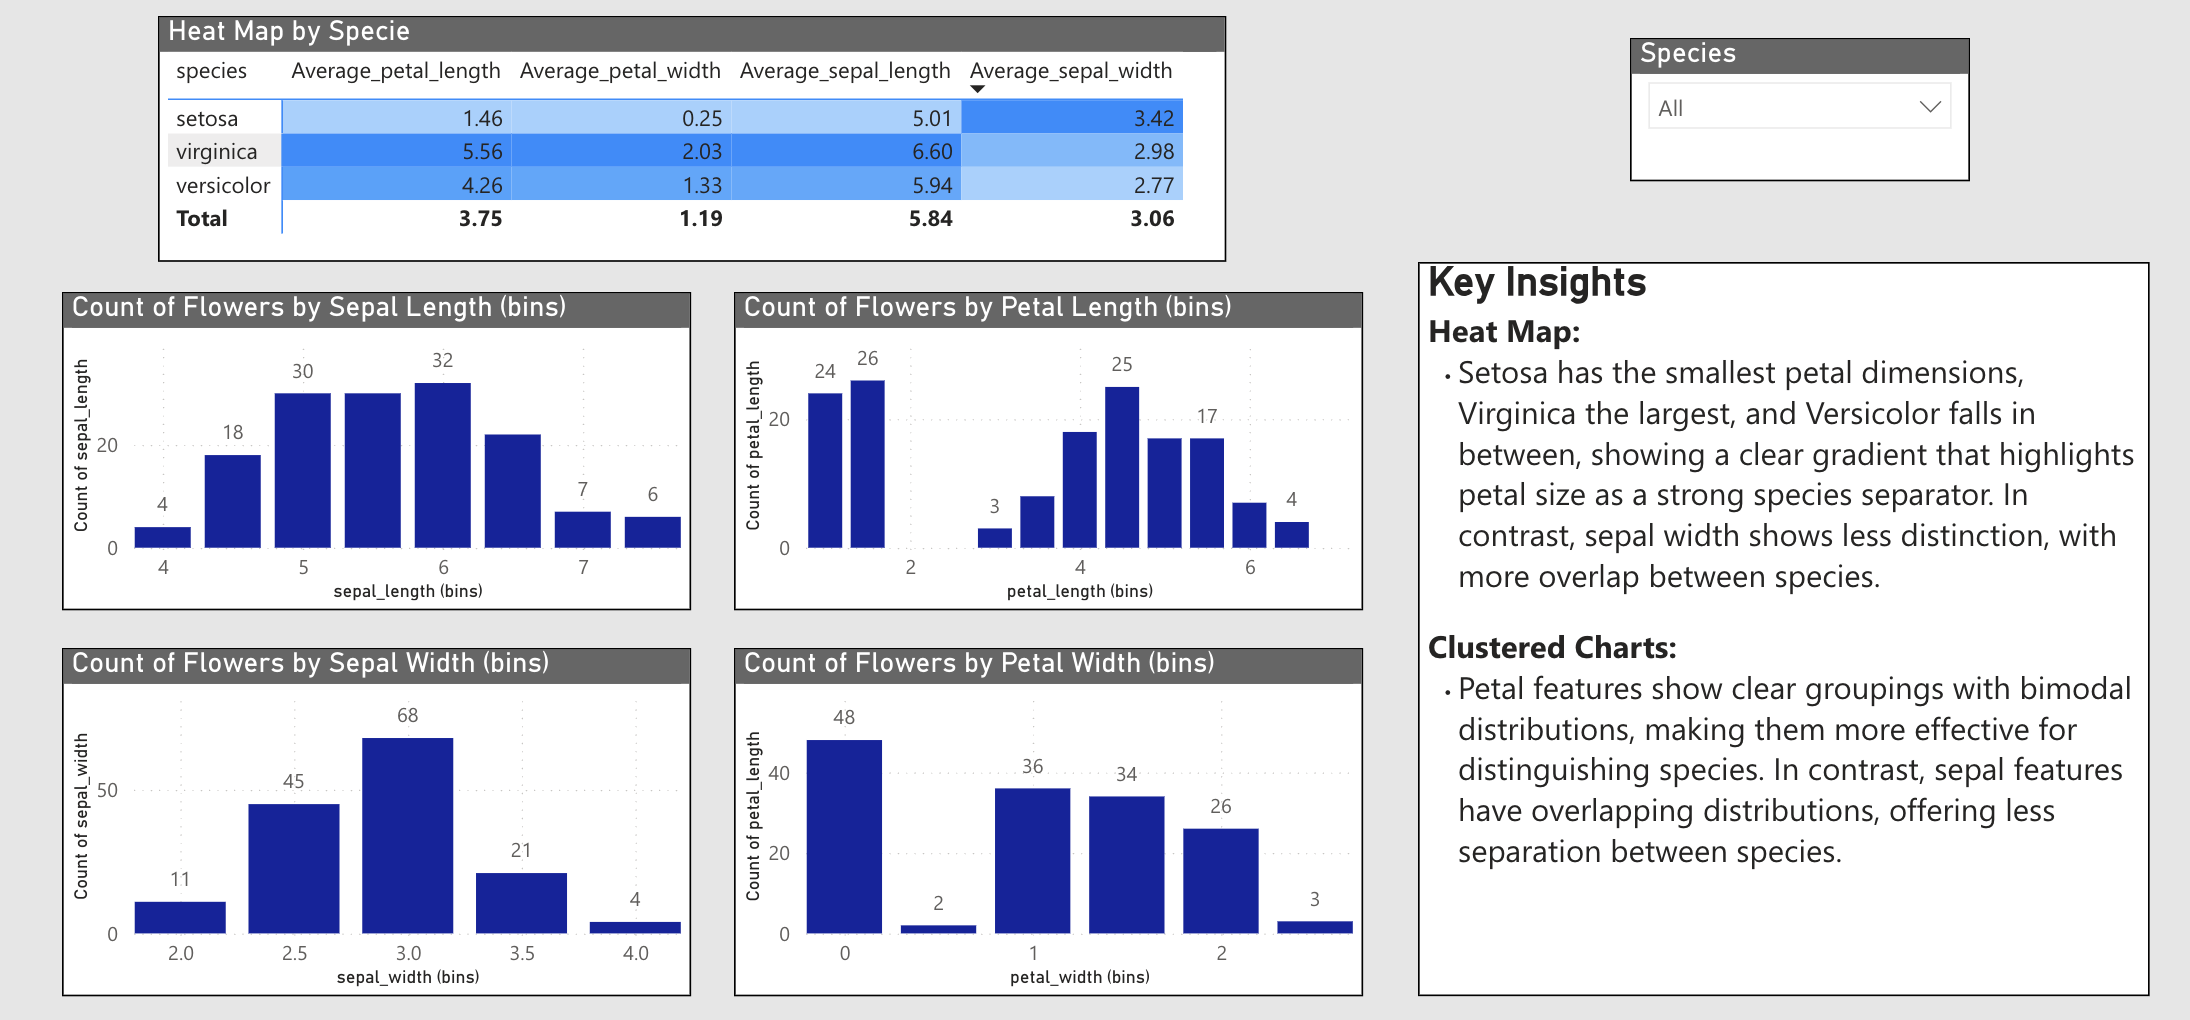
Interactive analytical report focused on species-level morphology patterns from the Iris dataset.
The project demonstrates how exploratory visuals can support classification understanding and
communicate model-ready insights to non-technical audiences.
Dataset
Iris dataset with petal and sepal measurements across three species.
Core Stack
Power BI, DAX, visual storytelling, comparative morphology views.
Main Goal
Identify how feature distributions separate species clusters.
Delivery
Compact dashboard for teaching, exploration, and quick species analysis.
Analytical Focus
Compared feature ranges to detect natural boundaries between species groups.
Evaluated overlap risk in pairwise relationships across petal and sepal variables.
Designed visuals to highlight interpretable decision regions for classification tasks.
Dashboard Screens
Exploratory analysis of feature distributions by class.Comparative morphology view to evaluate class separability.