Dataset
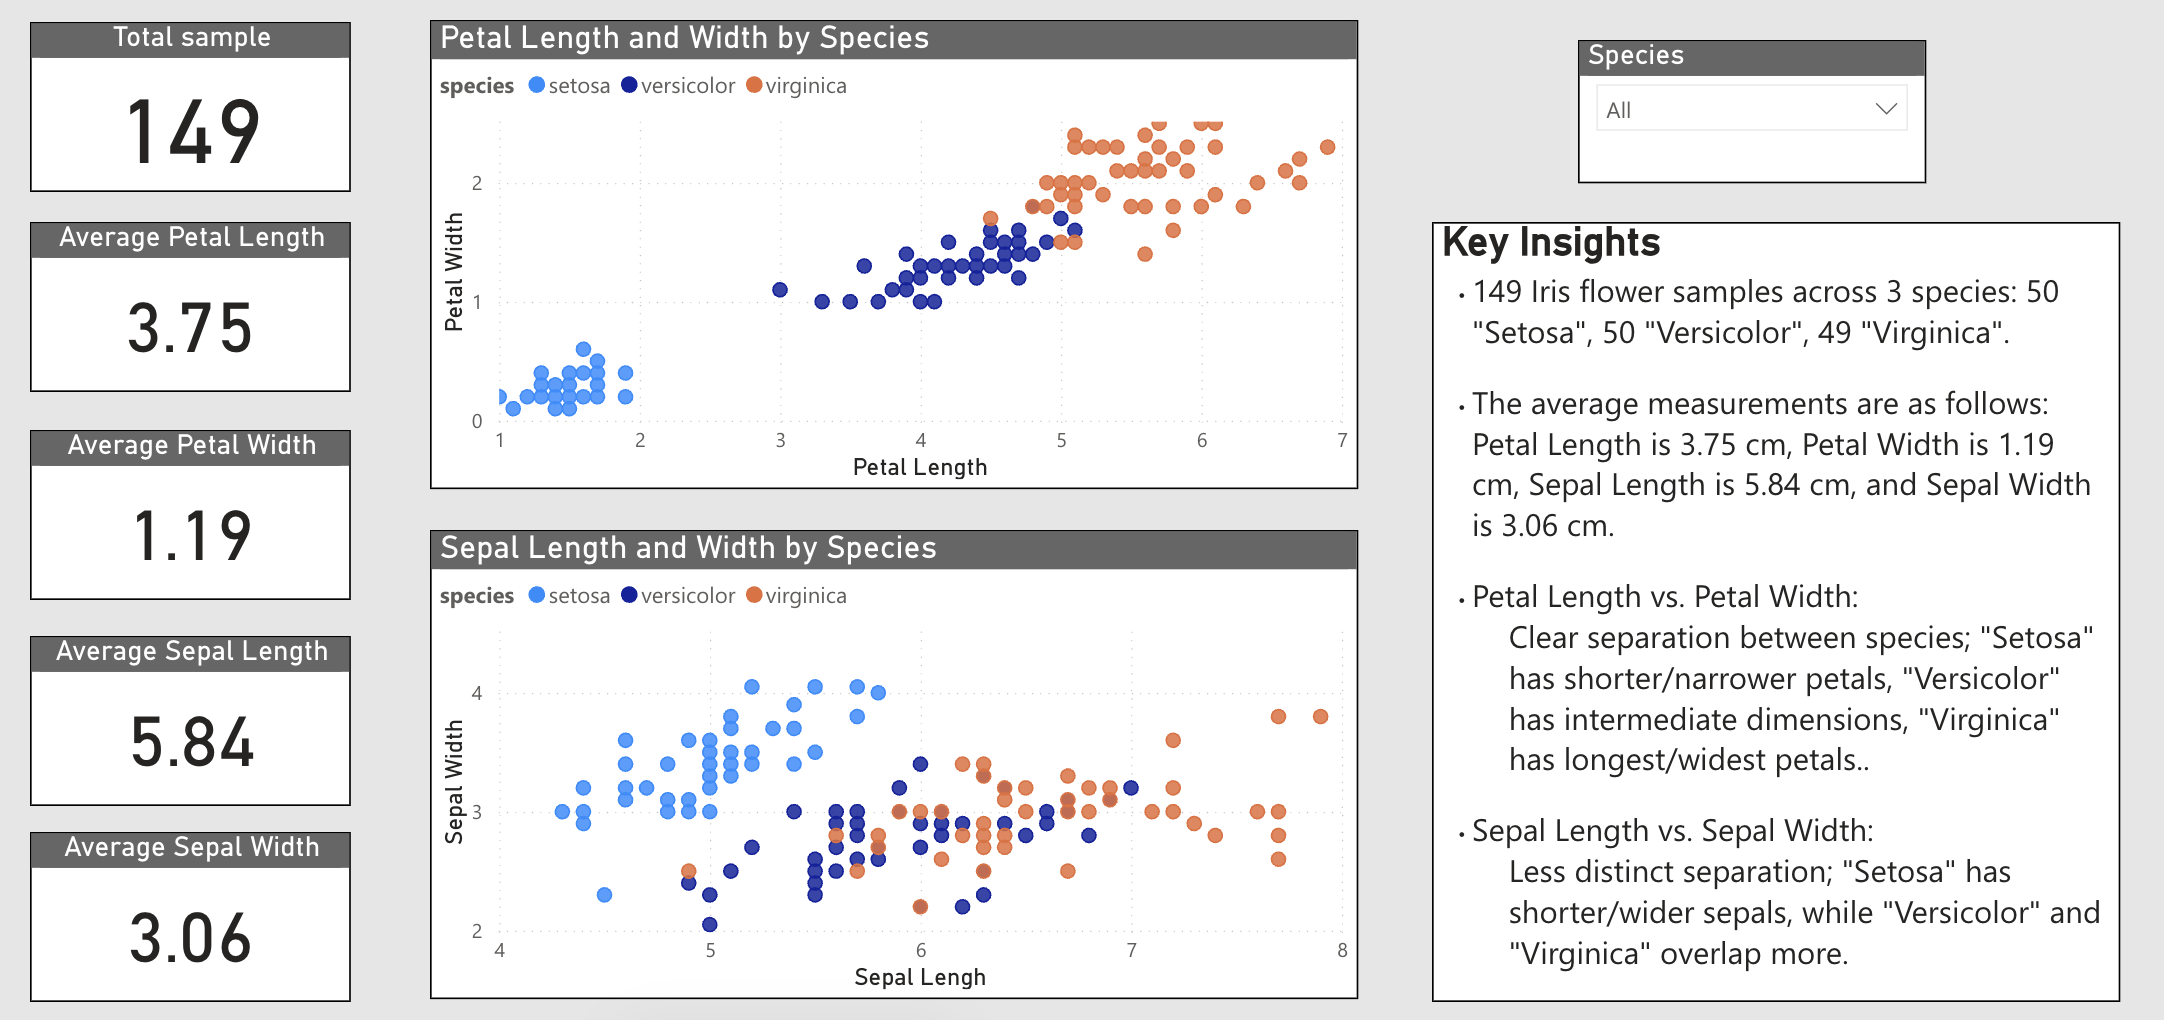
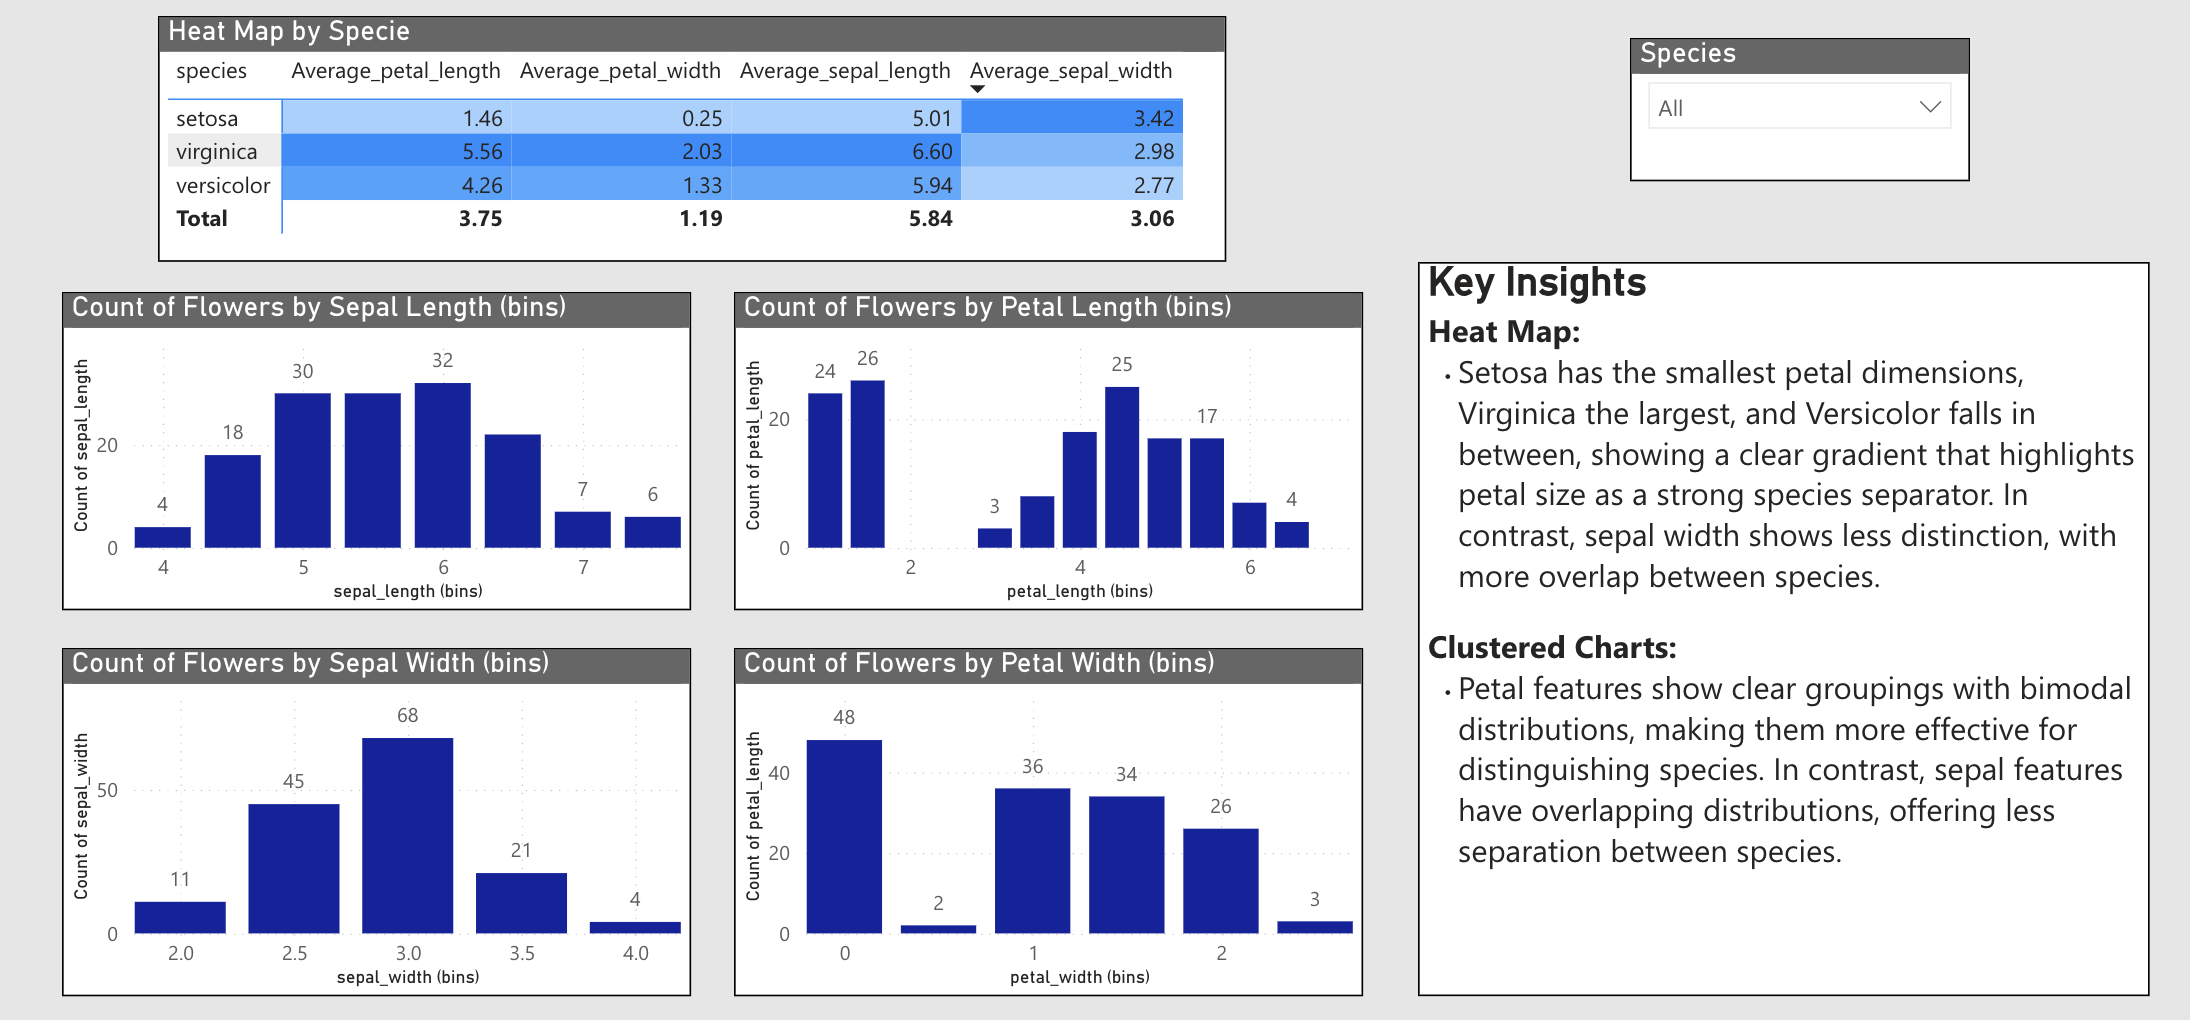
Iris dataset with petal and sepal measurements across three species.
Interactive analytical report focused on species-level morphology patterns from the Iris dataset. The project demonstrates how exploratory visuals can support classification understanding and communicate model-ready insights to non-technical audiences.
Business questionWhich measurements reliably separate the three iris species, and how can that be shown clearly to a non-technical audience?